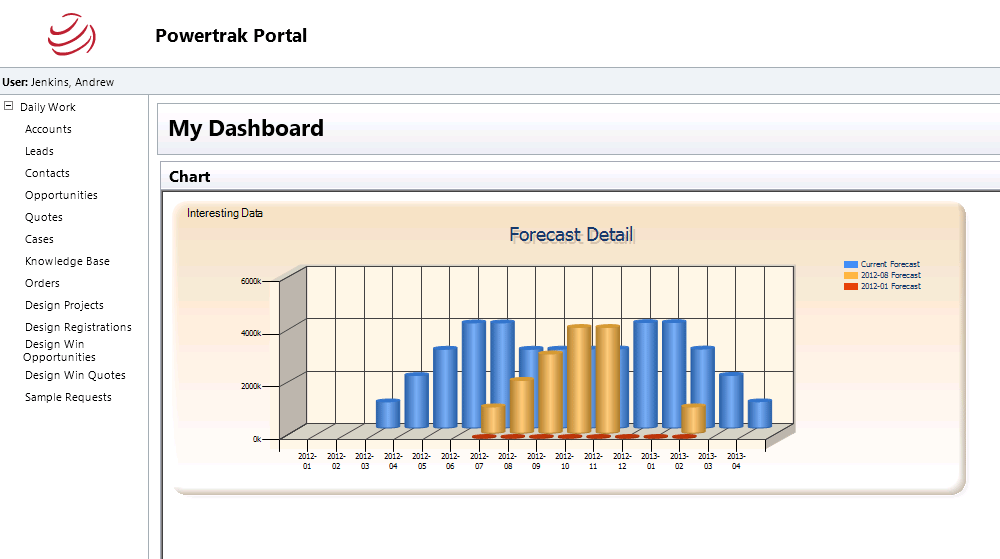
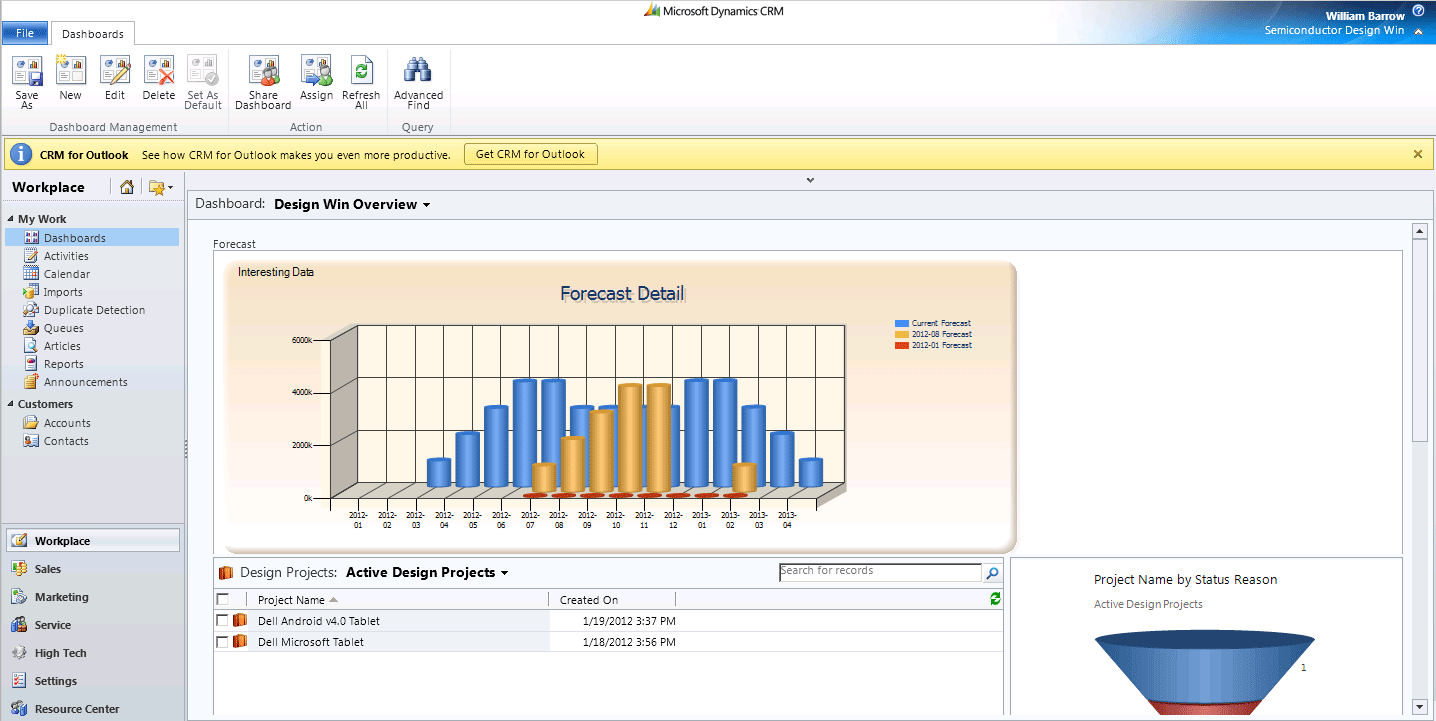
Give your Charts and Graphs a makeover with Powertrak. Add a little sizzle and make them pop with 3D capabilities.
Powertrak Charts brings extensive charting and dashboard capabilities to both Microsoft Dynamics CRM and Powertrak Portal. It’s the perfect example of using the Powertrak API to read Data from Powertrak Data Sources. This application uses the .NET 4.0 Charting Control to actually build the Charts; however, the data is retrieved from the Data Sources defined in Powertrak.
"3D is just one of the many charts that can be made. This tool allows you to create charts based on any data held in your systems through the capabilities provided by the Powertrak Platform. The charting component is actually the .Net 4.0 Charting Control which Powertrak structures using a meta driven configuration and provides data to using the Powertrak Data Adapters technology."
-William Barrow, CTO at Axonom
Build a 3D Chart in Powertrak Portal…

Also, create a dashboard chart in Microsoft Dynamics CRM…

Charts have the following settings configured in Powertrak:
- Charts
- Chart Border Skins
- Chart Titles
- Chart Title Element Positions
- Chart Legends
- Chart Legend Element Positions
- Chart Annotations
- Chart Annotation Smart Label Style
- Chart Areas
- Chart Area 3D Style
- Chart Area Axis X
- Chart Area Axis Y
- Chart Area Axis X2
- Chart Area Axis Y2
- Chart Series
- Chart Series Custom Properties
If you have any questions or would like to add this to your CRM dashboard, please contact us at sales@axonom.com.