The result is a fast, responsive, and intuitive interface for forecast data entry.
The dimensional data grid functionality adds additional flexibility to the Powertrak Sales and Product Forecasting module. Already equipped with in-line editable grids, the module gains the ability to present data dynamically over two related dimensions and to allow users to edit that data in-line.
Users can flip the axes of the grid at will; with one click of a button, columns display as rows and rows display as columns. Read more about this in Axonom’s Dimensional Data Grid press release.
Graphical user interface studies show it is easier for people to consume and work with data that is closely grouped on the page,” said William Barrow, CTO at Axonom. “Studies also show that people move their eyes horizontally, across rows rather than down columns. As a result of this new functionality, we know that end users will be more productive.”
Flip the Axis of the Grid with the Invert Button
Initial View
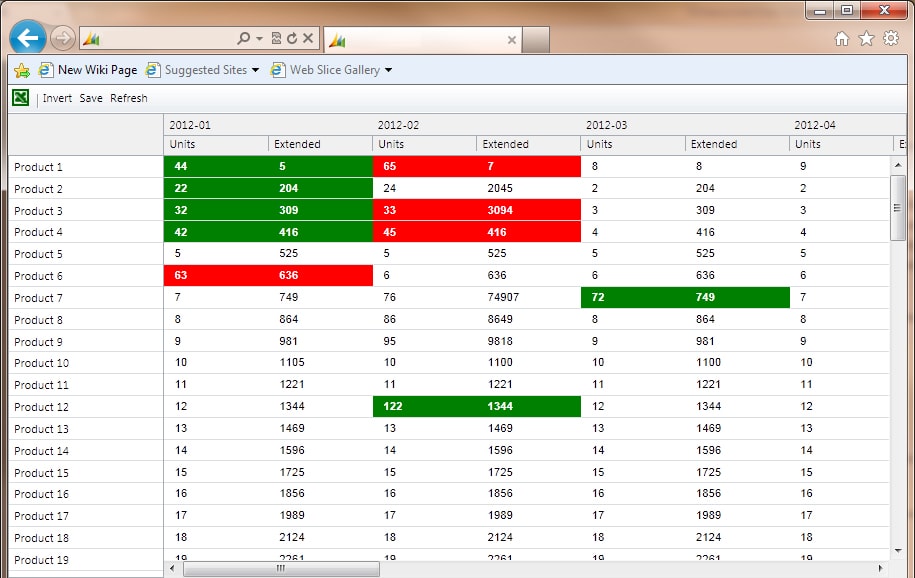
Notice that the products are listed in rows and dates in columns. I will now push the invert button…
Inverted View
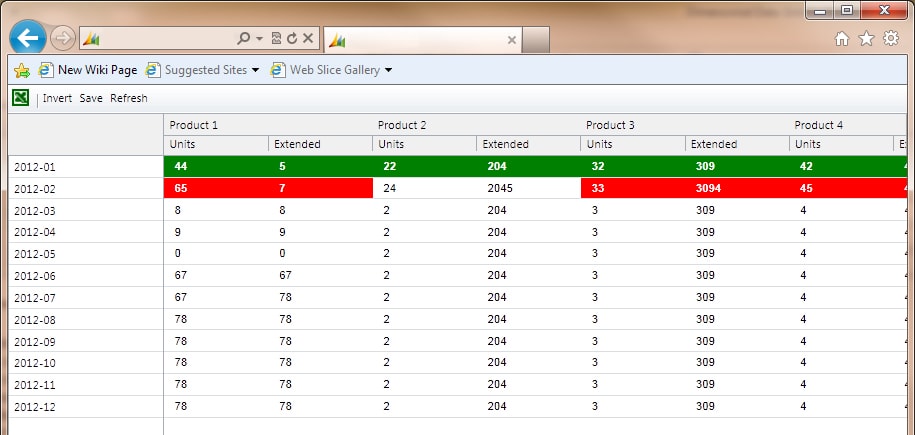
The products are now listed in columns and dates in rows.
Dimensional Data Grid Breakdown
- Users enter data directly into the cells, spreadsheet-style.
- Both row and column headers are pinned. Scroll through the data independently.
- Changed cells get highlighted red, similar to changed rows in our editable grids.
- The changed cells that have been saved are highlighted in green.
- Refresh discards changes. The user is warned if they still have pending changes unsaved.
- The Invert button flips the axes. This doesn’t do a full refresh – all unsaved cell changes are preserved.
- Fully configurable in Application Builder. Customizers can set up the horizontal, vertical dimensions and the grid contents to load from any data source in the system, and can set up any number of sub-columns.
To see this functionality in action, please request a demonstration.
By Michael Bauer